

 Zh
Zh Vi
Vi Ar
Ar De
De Es
Es Ru
Ru Hi
Hi


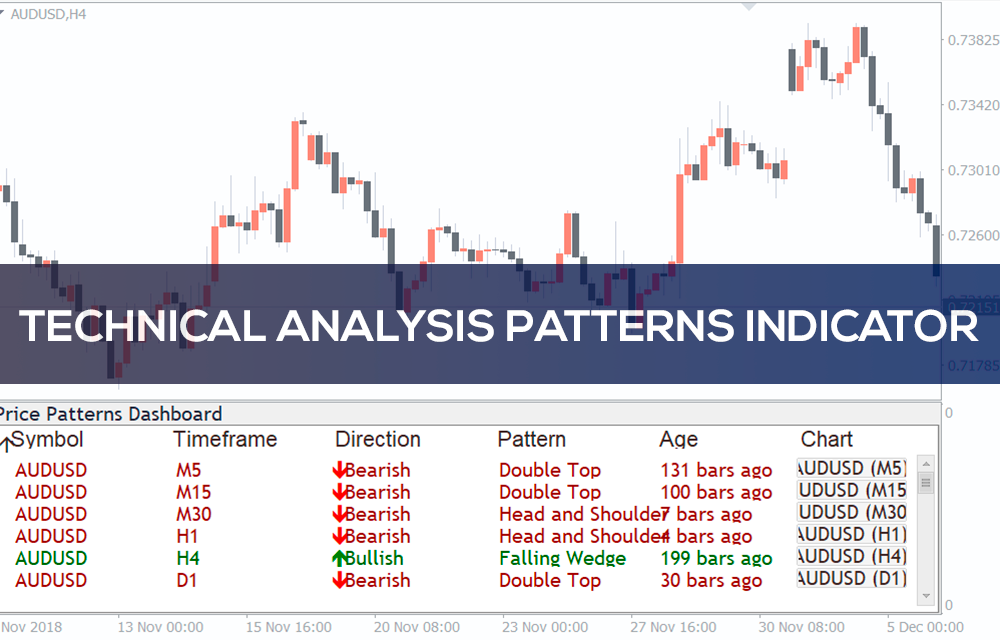


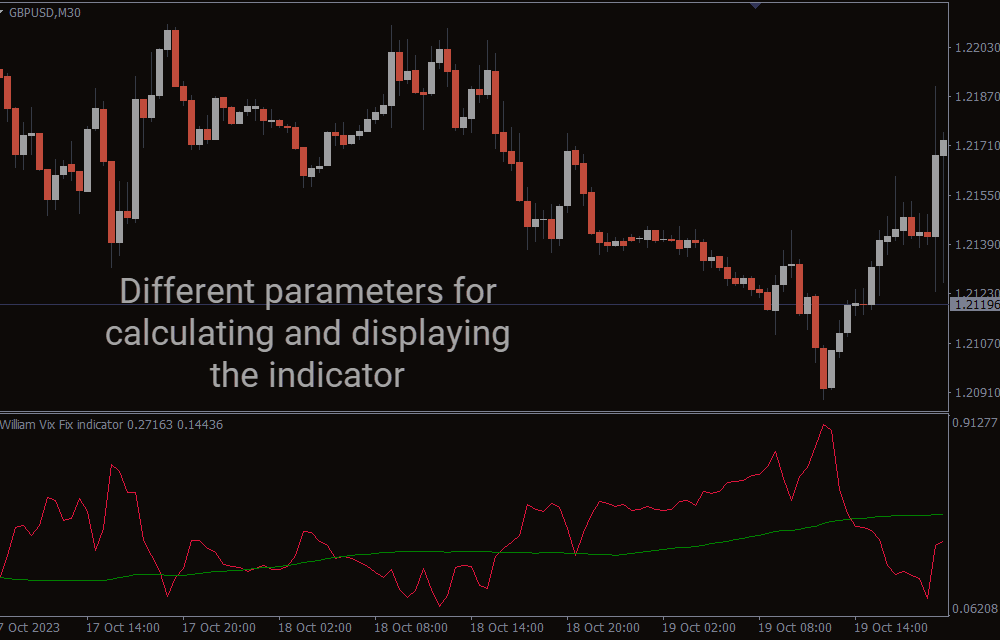
Chart patterns are popular techniques many traders use to accurately enter and exit trade. They particularly help traders understand the condition of the market, and whether the price will continue in its current trend or reverse. The most popular chart patterns always watched out for by traders are the double top and double bottom, head & shoulders, inverse head & shoulder, rising and falling wedges, bullish and bearish rectangles, bearish and bullish pennants, triangle (symmetrical, ascending, descending), and flag. By using the Technical Analysis Forex Patterns Indicator, traders can easily identify these patterns on any timeframes.

The foundation
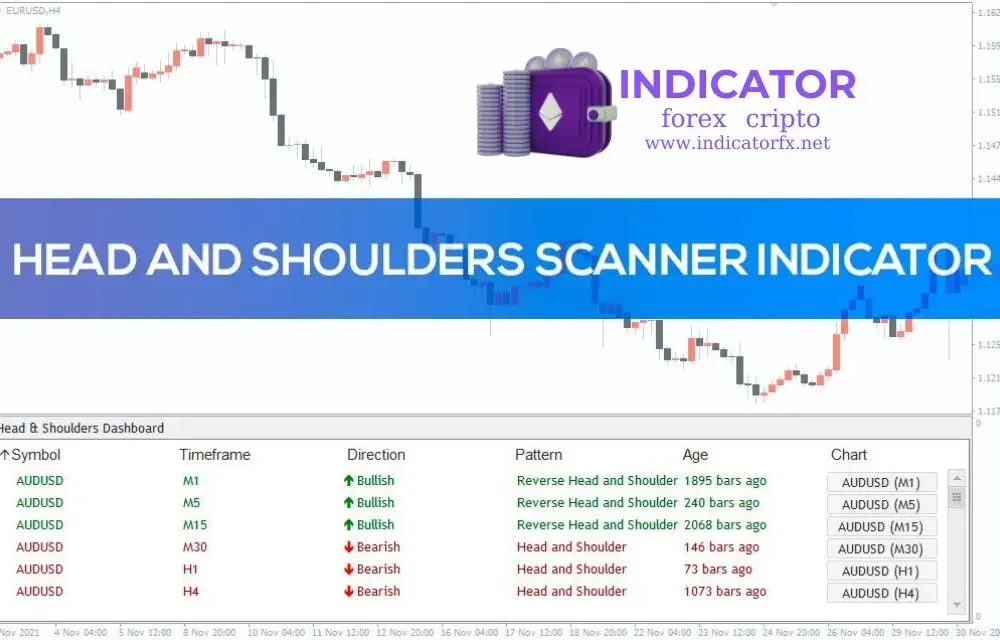
The Technical Analysis Forex Patterns Indicator for MT4 scans for all price patterns formed on any currency pairs in all the timeframes. This indicator displays all the chart patterns formed on the MT4, the timeframe the pattern was formed, and the time (ages) of the pattern formation. Thus, this indicator allows traders to have quick and accurate knowledge of all the patterns forming on all currency pairs and in all timeframes.
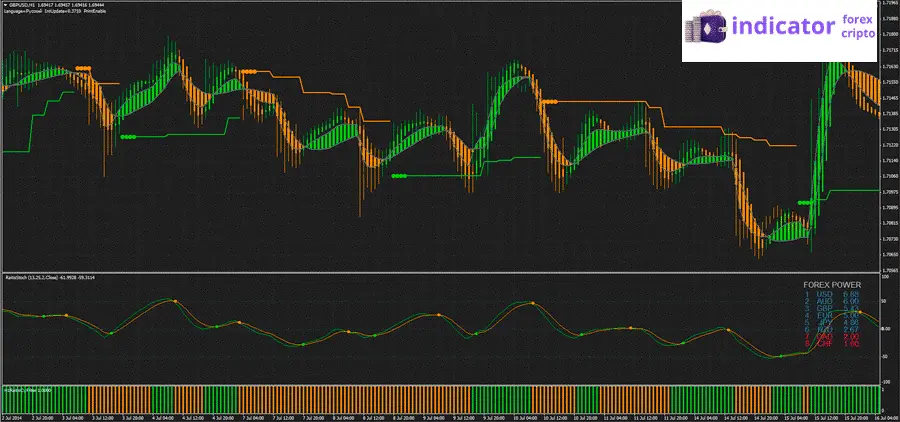
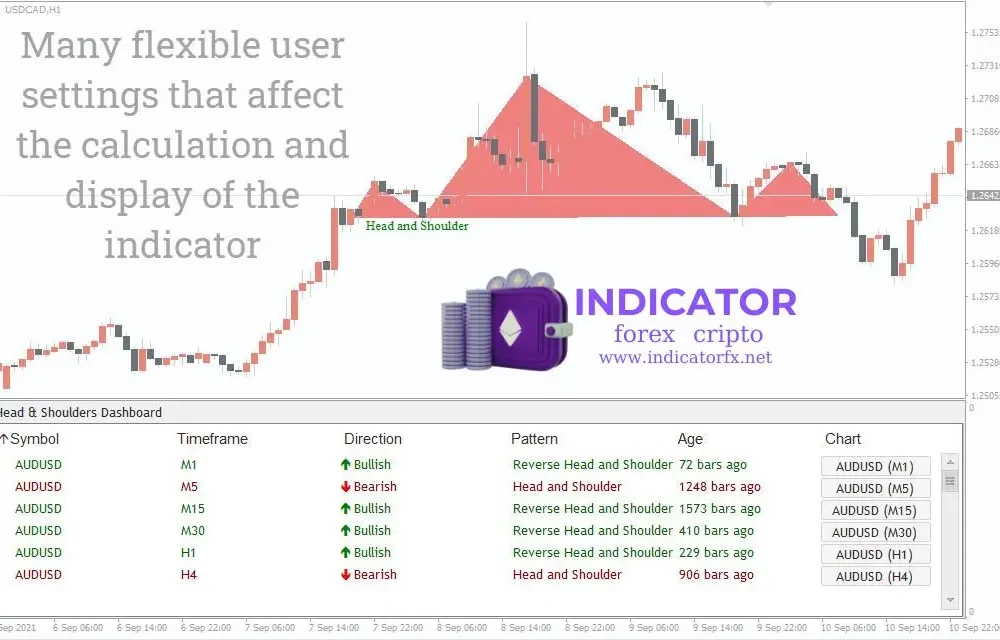
The diagram below shows the Chart Pattern Indicator on the MT4 chart.
From the USDCHF M30 chart above, the Price Pattern displayed the symbol, timeframe, direction, patterns, age, and the chart icon.
The symbol icon shows the currency pairs in which a particular chart pattern is formed after being scanned by this indicator. On the other hand, the timeframe icon shows the currency pairs’ timeframe in which a specific pattern is formed by this indicator. Furthermore, the direction icon shows the current direction of the currency pair while the ages icon displays the time this chart pattern was formed on the currency pair.
The Pattern icon displays the particular chart pattern formed on a particular currency pair in a particular timeframe. The pattern formed on the chart displayed by this indicator on the board could be:
- Double Top or Double Bottom pattern;
- The head and shoulder pattern;
- Reverse Head and Shoulder pattern;
- The Triple Top or Triple Bottom patterns;
- The Triangle patterns;
- Rising Wedge or Falling Wedge pattern.
The Chart Pattern Indicator helps traders view all the important price patterns formed on all currency pairs in all timeframes at a glance. This, this eliminates the stress of switching over one currency pair and timeframes to another. Furthermore, traders can easily know whether a price will continue or reverse since this indicator shows the direction of the pair. This indicator can also be used to know the accurate time to enter and exit the forex market.
The Chart Pattern Indicator works in all timeframes and for all currency pairs. Furthermore, it can be used in all market conditions and suit all trading styles. This indicator is best for scalping, day trading (intraday), swing trading and long-term (position) trading.
Indicator Settings
The Chart Pattern Indicator has the following parameters in the MT4 settings.
Dashboard settings: The dashboard settings.

Symbols: The symbol of the currency pairs scanned for and a price pattern.
- Is M1 timeframe enabled: Command to activate or deactivate the 1-minute (M1) timeframe on this indicator.
- Is M5 timeframe enabled: Command to activate or deactivate the 5 minutes (M5) timeframe on this indicator.
- Is M15 timeframe enabled: Command to activate or deactivate the 15 minutes (M15) timeframe on this indicator.
- Is M30 timeframe enabled: Command to activate or deactivate the 30 minutes (M30) timeframe on this indicator.
- Is H1 timeframe enabled: Command to activate or deactivate the 1-hour (H1) timeframe on this indicator.
- Is H4 timeframe enabled: Command to activate or deactivate the 4 hours (H4) timeframe on this indicator.
- Is D1 timeframe enabled: Command to activate or deactivate the daily (D1) timeframe on this indicator.
- Is W1 timeframe enabled: Command to activate or deactivate the weekly (W1) timeframe on this indicator.
- Is MN timeframe enabled: Command to activate or deactivate the monthly (MN) timeframe on this indicator.
Sort by: how the indicator should sort the currency pairs.
Conclusion
The Chart Pattern Indicator for MT4 displays all the price patterns formed on all currency pairs in all timeframes at a glance. This indicator works in all timeframes and for all currency pairs. This indicator can be used in all market conditions and suit all trading styles. Traders can adjust this indicator in the indicator settings to suit their trading systems.
8 reviews for Technical Analysis Forex Patterns Indicator
There are no reviews yet.