

 Zh
Zh Vi
Vi Ar
Ar De
De Es
Es Ru
Ru Hi
Hi


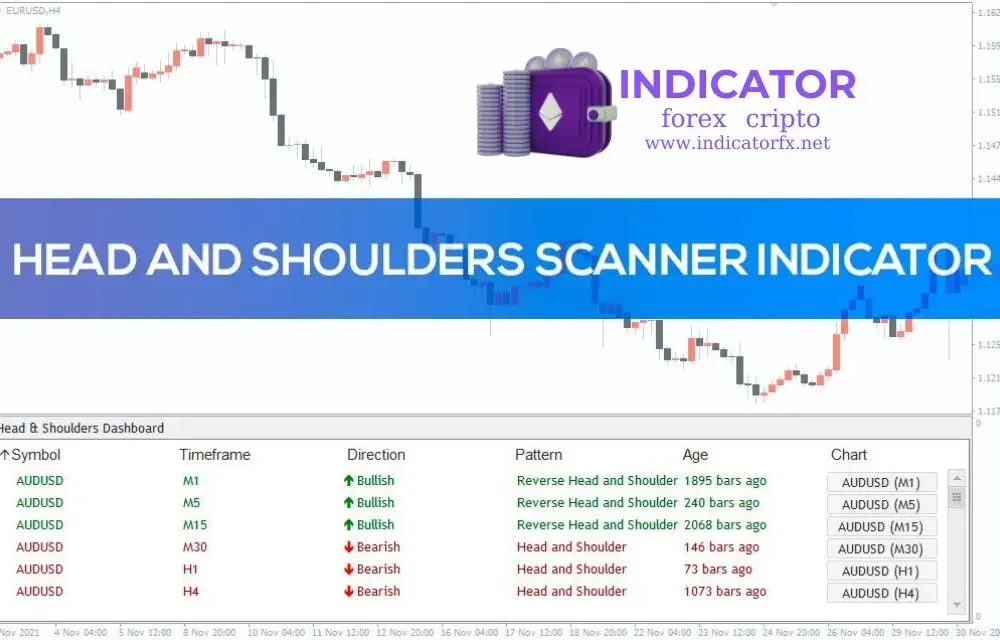


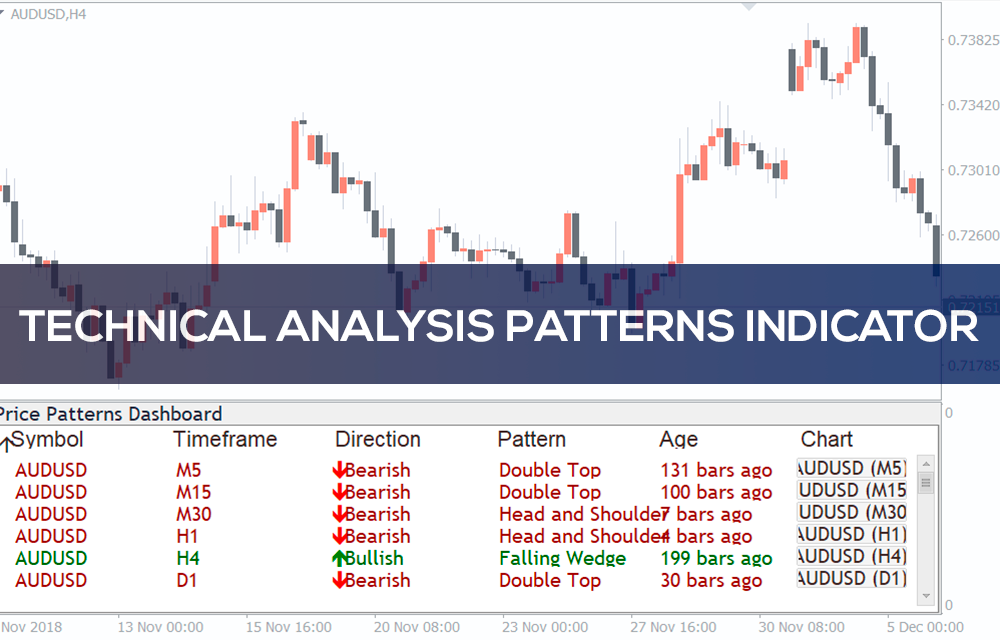
Head & Shoulders Visual Indicator For MT4 automatically scans the chart for head and shoulders candlestick patterns. Obviously, the scanner shows the Symbol, Timeframe, Direction, Pattern Name, Age, and Chart time frame in which the head and shoulders pattern is identified.
Furthermore, the scanner displays the inverted head and shoulders pattern also. So, forex traders can BUY or SELL based on the head and shoulders candlestick pattern. Additionally, the indicator also scans and plots emerging head and shoulders patterns. So, forex traders can follow the pattern and prepare technical trading strategies in advance.
The indicator is well suited for new and advanced forex traders. It can be applied to all intraday chart time frames and the daily, weekly, and monthly charts.
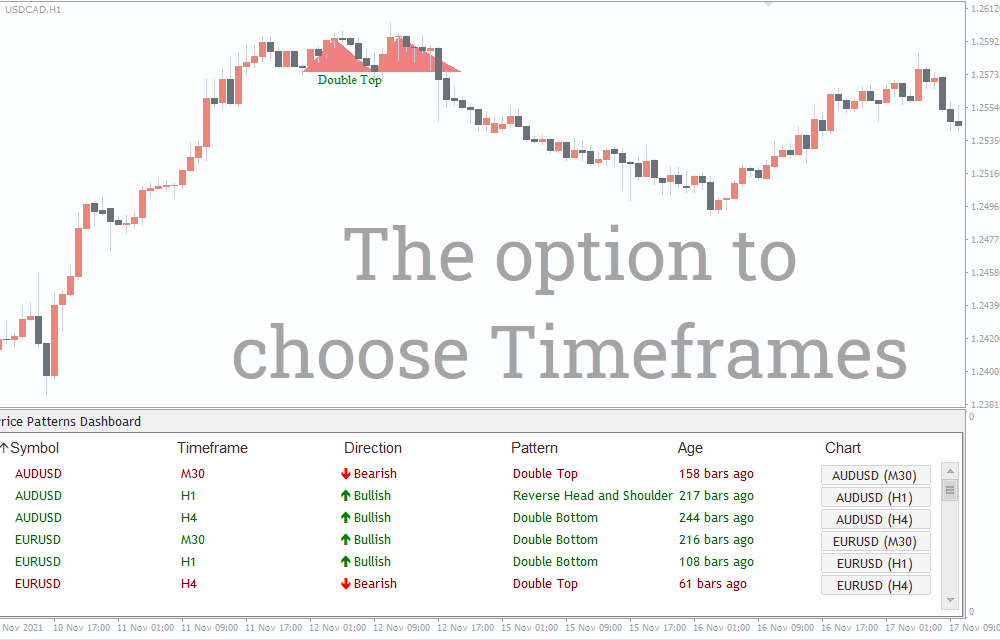
Head & Shoulders Visual Indicator For MT4 Trading Setup
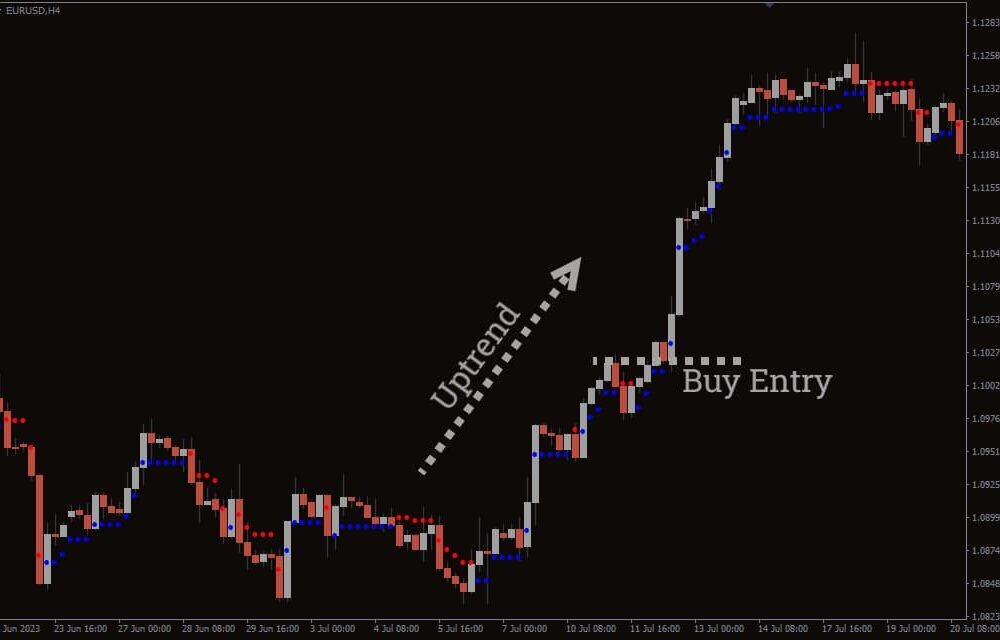
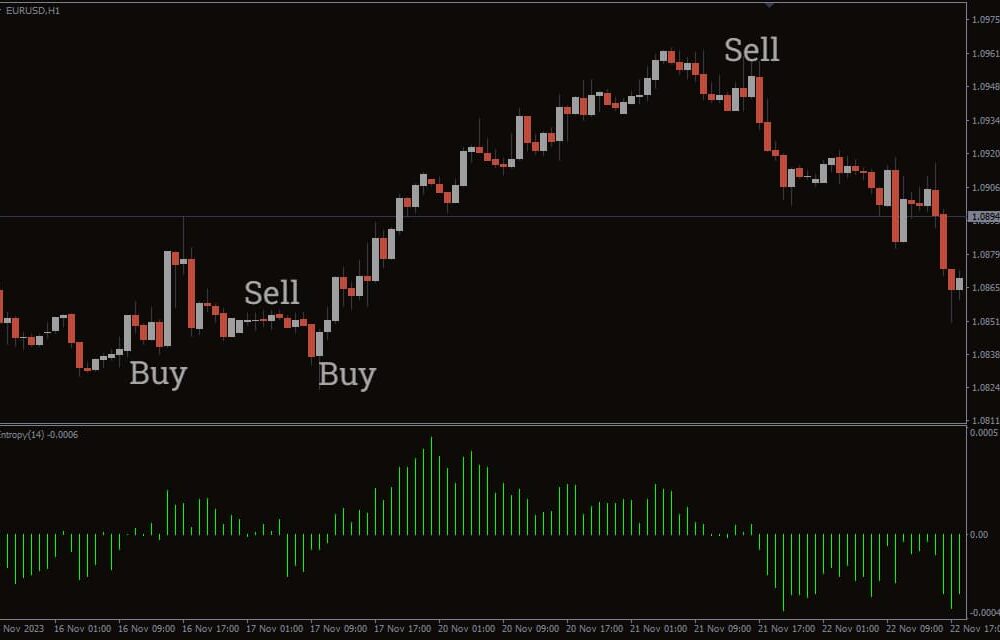
The above USDCAD daily price chart shows the H&S scanner indicator for MT4 in action. The indicator shows the Bullish and Bearish patterns in GREEN and RED color respectively.

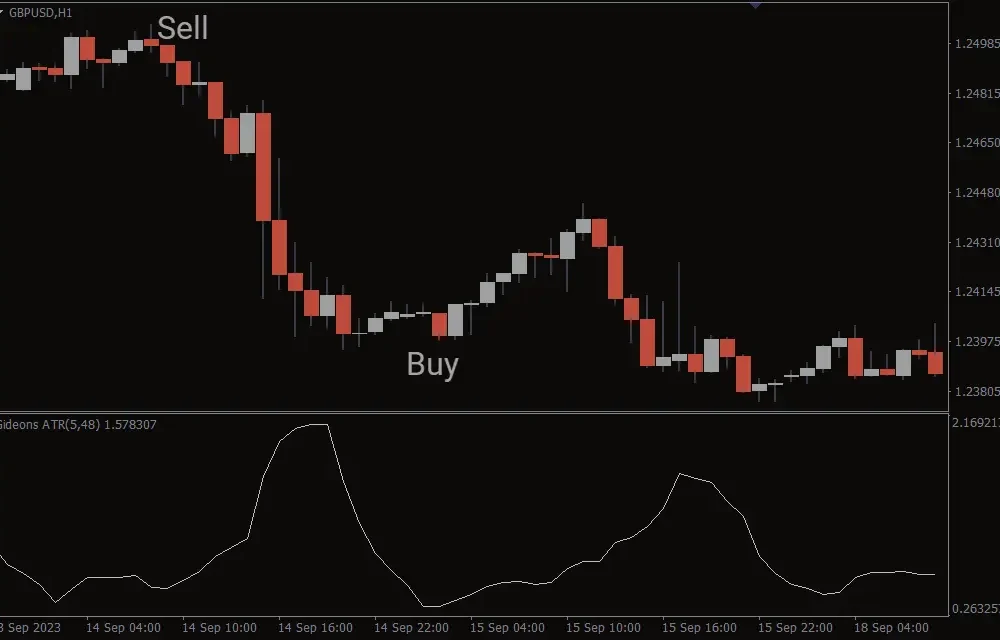
The Head & Shoulders pattern is a Bearish candlestick pattern. So, forex traders can SELL once the price breaks below the neckline with a stop loss above the head. However, the best take profit point is twice the size of the pattern from the neckline to the head.
Similarly, the Reverse Head and shoulders pattern is a Bullish candlestick pattern. So, traders can enter the market with a BUY position once the neckline breakout happens to the upside. The best stop loss point is below the head, while the take profit is double to size of the pattern from neckline to head.
Conclusion
Indeed, the Head & Shoulders scanner indicator for MT4 helps the forex candlestick pattern trader by automatically scanning the charts. This helps the trader to focus on trading the pattern than spending time to identify and locate the pattern. Additionally, this indicator is free to download and easy to install.
Indicator Settngs
- Symbols: Pairs used for checking the pattern.
- The following options Is M1 Timeframe Enabled to Is MN Timeframe Enabled: Scans for the head and shoulders patterns on this chart particular timeframes accordingly.
- SortBy: Sorts by Symbol, Timeframe, Direction, Pattern, Age, Completion.
- Sort Type: Either by ascending or descending order.
- Price Proximity Percent: Level of proximity.
- Fill Patterns with Color: Colors the pattern area.
- Display head and Shoulder: This shows the pattern in the chart.
- Display Reverse Head and Shoulder Pattern: This shows the pattern in the chart.
- Maximum number of bars for patterns search: Number of history bars to check.
- Display Swings: Shows the swings.
- Depth: ZigZag settings.
- Deviation: ZigZag deviation.
- Backstep: Zigzag backstep calculation.
- Bull Pattern Color: Color for a bull pattern.
- BearPatternColor: Color for a bear pattern.
- Forming Pattern Color: Color for an emerging pattern.
- Pattern Line Width: Line width.
- Forming Pattern Line Width: Line width of an emerging pattern.
- Line Style: Style of line.
- LabelFontSize: Font size.
- LabelColor: Color.
- PopupAlerts: Enables pop-up alerts.
- EmailAlerts: Emails the alerts.
- PushAlerts: Sends alerts to a mobile device.
- SoundAlerts: Provides sound alerts.
- SoundFile: Sound name.

Reviews
There are no reviews yet.