

 Zh
Zh Vi
Vi Ar
Ar De
De Es
Es Ru
Ru Hi
Hi


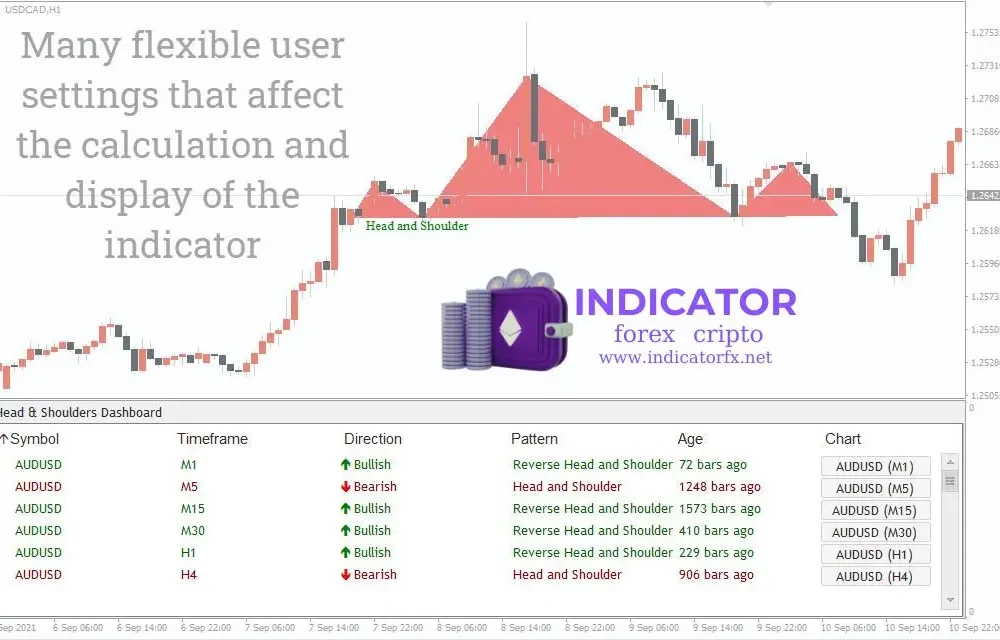
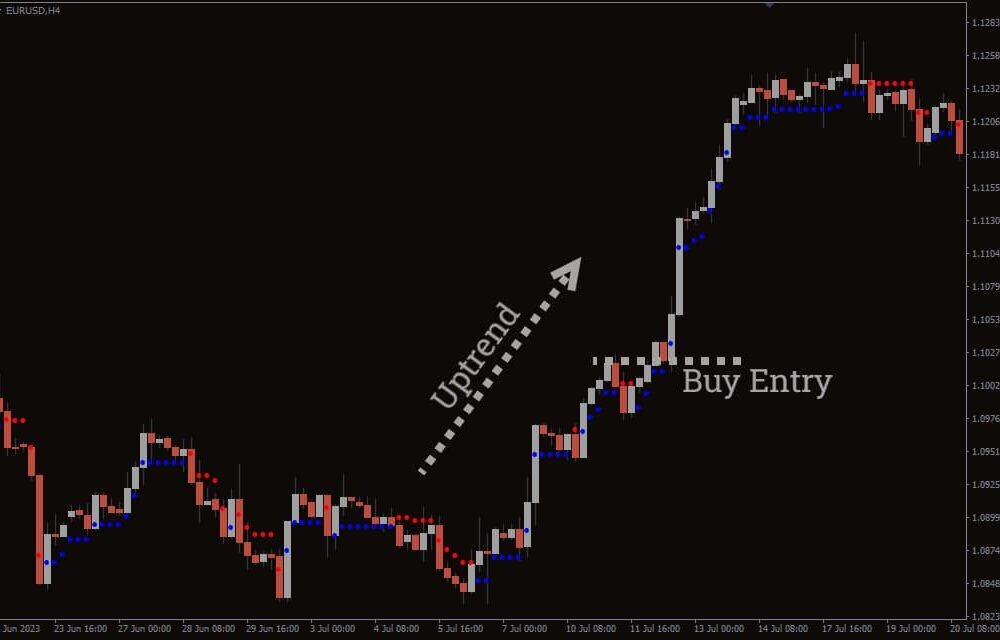
Supply and Demand Zone Indicator for MT4: Automate Your Multi-Time Frame Forex Trading
Easily Identify Trading Opportunities
Are you having difficulty identifying key support and resistance levels in the forex market? The Supply and Demand Zone Indicator For MT4 simplifies your technical analysis by automatically detecting the zone. This powerful tool allows you to make informed trading decisions based on past price behavior.

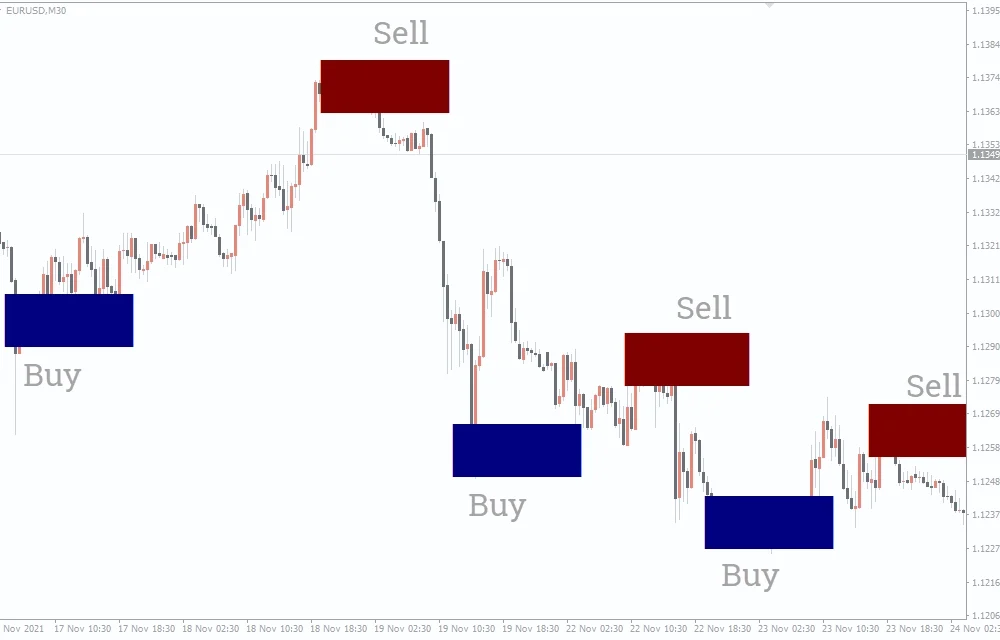
What is the Supply and Demand Zone?
Supply and demand zones represent areas on the chart where buying and selling pressures collide significantly, affecting price movements. These zones often act as invisible barriers, causing prices to reverse or pause when revisited.
How Do Indicators Work?
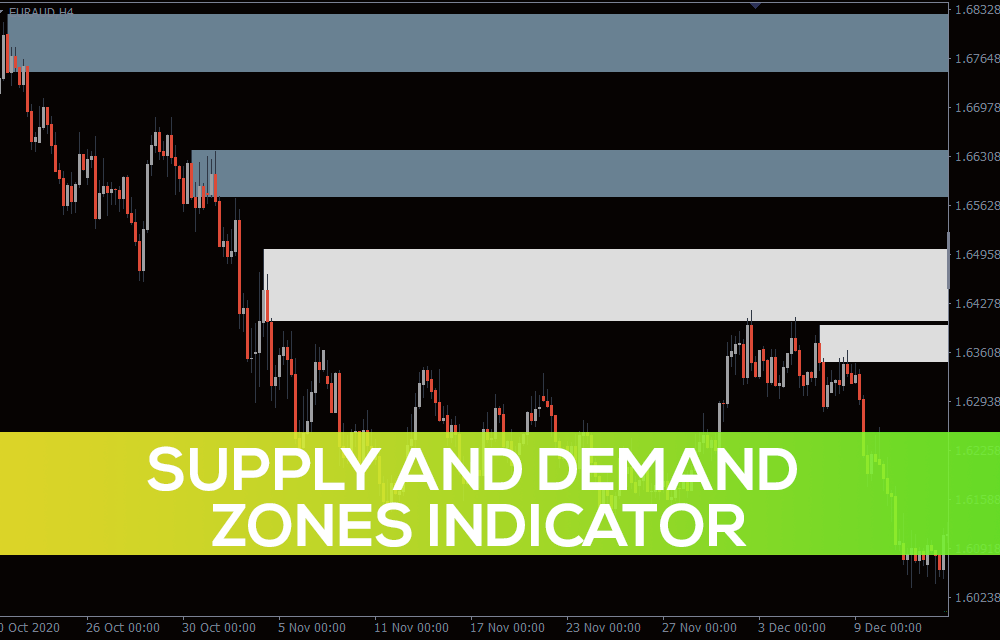
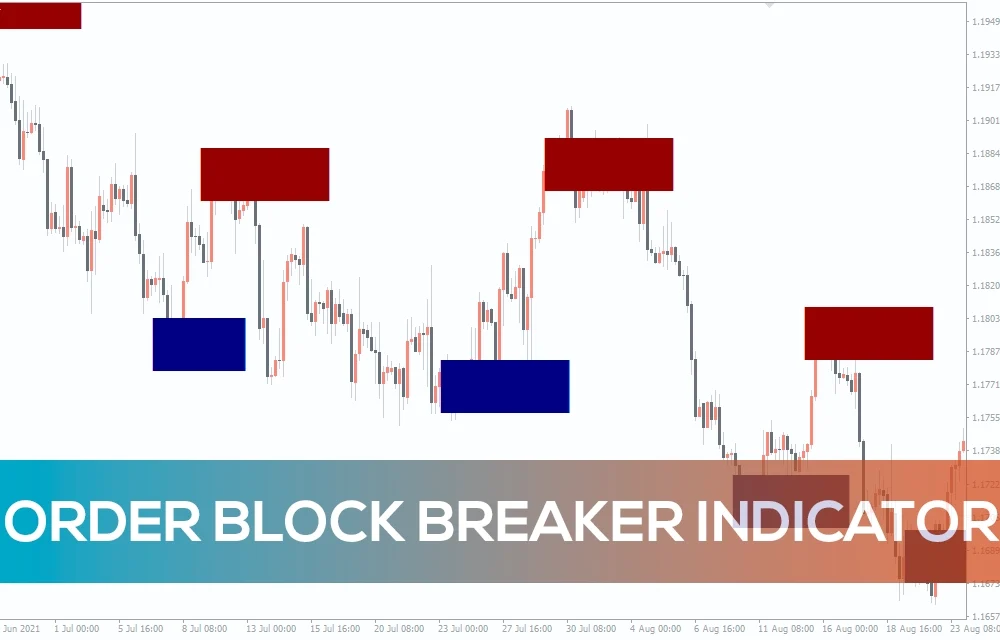
The Supply and Demand Zones indicator automatically highlights these zones on your MT4 chart with two distinct colors:
- White Zone: Indicates areas where price has recently interacted, indicating a strong zone.
- Gray Zone: Represents potential future support/resistance based on past price action.
Key Features and Benefits:
- Easy Zone Identification: Save time and eliminate manual zone drawing with automatic detection.
- Multi-Timeframe Analysis: Get valuable insights from zones across multiple timeframes. (Example: Daily and Hourly)
- Fibonacci Integration: Visualize potential retracement levels in zones using the Fibonacci retracement tool.
- Area Strength Discrimination: Focus on high potential areas with the ability to filter out weaker areas.
- Fully Customizable: Adjust the indicator’s display to your preferences with a variety of color options and settings.
Who Should Use This Indicator?
- New Forex Traders: Get a valuable tool to simplify identifying support and resistance.
- Experienced Traders: Enhance your technical analysis with automatic zone detection and confirmation.
Take Your Trading to the Next Level
The Supply and Demand Zone Indicator allows traders of all experience levels to leverage the power of supply and demand in their forex trading strategies. Download the indicator today and experience the benefits of automatic zone detection!
How to install
Below are the settings that come with the supply and demand zone indicator.

Timeframe: Select the timeframe whose area you want to view on your current chart.
- DrawZones: Removes all zones from the chart when set to “false”.
- SolidZones: Add or remove colors to zones.
- SolidRetouch: Add or remove color from edited areas.
- RecolorRetouch: Allows edited areas to have a new color.
- RecolorWeakRetouch: Allows weakly edited areas to have a new color.
- ZoneStrength: No visible effect on the chart.
- NoWeakZones: This allows you to add or remove weak zones.
- DrawEdgePrice: Set the currency pair price at the edge of each zone.
- ZoneWidth: No visible effect on the chart.
- ZoneFibs: Shows the Fibonacci retracement tool at the right end of the chart when it is set to “true” along with “HUDOn”.
- FibStyle: No visible effect on the chart.
- HUDOn: Places a triangle in the lower left corner of the chart upright or upside down, depending on the price direction in the two zones.
- On timer: No visible effect on graph.
- LayerZone: No visible effect on the chart.
- LayerHUD: No visible effect on the chart.
- CornerHUD: Describes the location where the HUD will be displayed.
- PosX: Change the position of the HUD.
- PosY: Change the position of the HUD.
- AlertOn: Alerts you when an area forms.
- AlertPopup: This displays a pop-up window for warning.
- ColorSupStrong: Change the color of the strong arc area.
- ColorSupWeak: Change the color of the weak arc area.
- ColorSupRetouch: Changes the color of the edited supply area.
- ColorDemStrong: Change the color of the area with strong demand.
- ColorDemWeak: Change the color of the weak bridge area.
- ColorDemRetouch: Change the color of the area that needs to be edited.
- ColorFib: Change the color of the Fibonacci retracement line.
- ColorHUDTF: Change the color of the HUD.
- ColorArrowUp: Change the color of the Up arrow.
- ColorArrowDn: Change the color of the Down arrow.
- ColorTimeBack: Change the back time color.
- ColorTimerBar: Change the color of the timer bar.
- ColorShadow: Change the shadow color.
- LimitZoneVis: No visible effect on the graph.
- SameTFVis: No visible effect on the graph.
- ShowOnM1: No visible effect on the chart.
- ShowOnM5: No visible effect on the chart.
- ShowOnM15: No visible effect on the chart.
- ShowOnM30: No visible effect on the chart.
- ShowOnH1: No visible effect on the chart.
- ShowOnD1: No visible effect on the chart.
- ShowOnW1: No visible effect on the chart.
- ShowOnMN: No visible effect on the chart.
- PriceWidth: No visible effect on the chart.
- TimeOffset: No visible effect on the chart.
- GlobalVars: No visible effect on the graph.
Jackson (verified owner) –
It is useful.